Roughness, Drag, and Dollars: Quantifying What Leading-Edge Erosion Actually Costs US Wind Operators
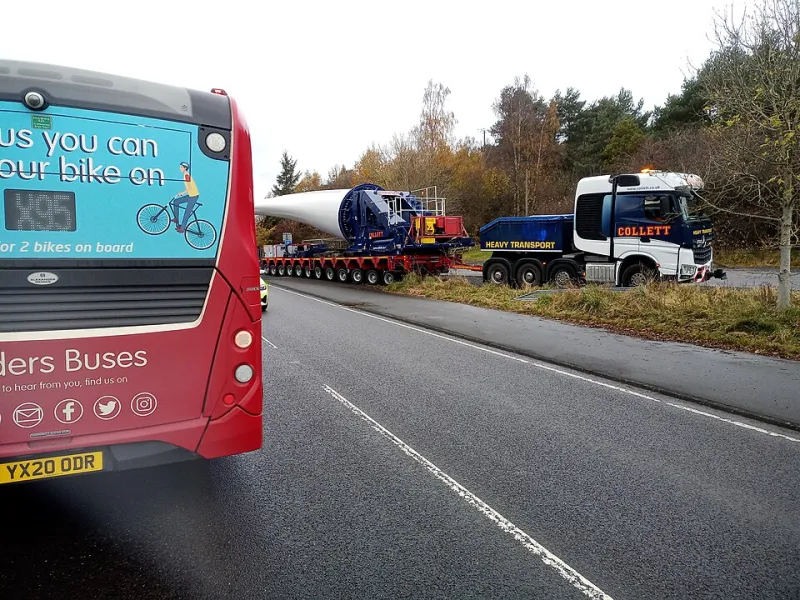
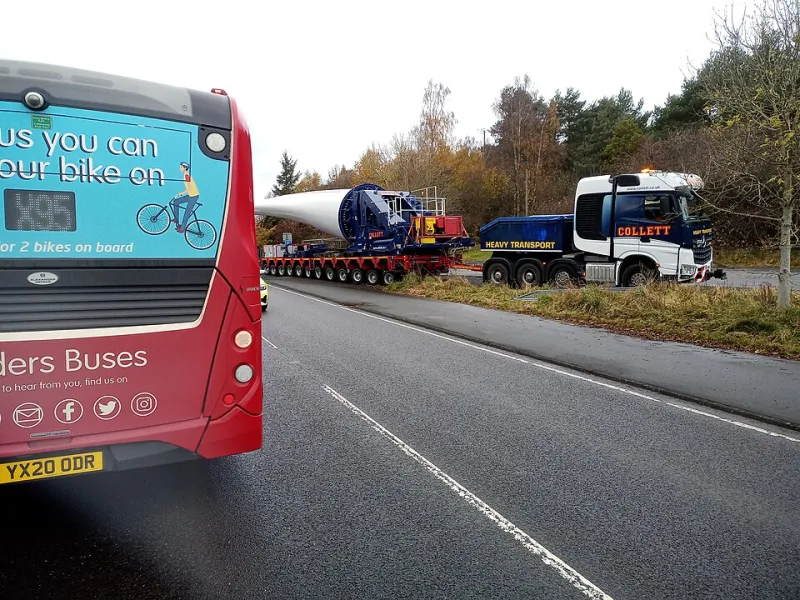
Photo: Victuallers, CC BY-SA 4.0, via Wikimedia Commons
A wind turbine blade is, at its core, an airfoil. Its entire purpose is to convert kinetic energy in moving air into rotational force with maximum efficiency. That efficiency depends critically on surface geometry—and surface geometry, on operating turbines, is never static. Rain, dust, insects, and ice impact the leading edge of a rotating blade at velocities that can exceed 200 miles per hour at the tip. Over months and years, those impacts erode the carefully engineered profile of the blade, introducing roughness, pitting, and eventually delamination that degrades the aerodynamic performance operators paid for at commissioning.
What makes leading-edge erosion particularly insidious from a performance standpoint is how gradually it manifests. There is no single failure event, no alarm triggered in the SCADA system. The blade simply becomes incrementally less efficient—generating slightly less lift, slightly more drag, year after year—until operators who examine long-term power curve data begin to notice a gap between expected and actual output that cannot be explained by wind resource variability alone.
The Aerodynamics of a Degrading Surface
To understand the performance penalty, it helps to examine what erosion physically does to airflow. A clean, smooth leading edge allows air to transition predictably across the blade surface, maintaining attached laminar flow over a wide range of angles of attack. As erosion introduces surface roughness—initially at scales measured in microns, later progressing to millimeter-scale pitting and gouging—that laminar flow breaks down prematurely. The boundary layer transitions to turbulence earlier along the chord, increasing skin friction drag and reducing the lift coefficient the blade can generate at a given wind speed.
Computational fluid dynamics modeling and wind tunnel studies have consistently demonstrated that even modest leading-edge roughness—comparable to what accumulates within two to three years of operation in high-precipitation environments—can reduce a blade's lift-to-drag ratio by measurable margins. Translated to turbine-level output, researchers at institutions including the National Renewable Energy Laboratory have estimated annual energy production losses attributable to erosion in the range of 1.6% to 5% per turbine, with the upper end of that range observed on older blades in operationally demanding environments.
For a 2-megawatt turbine operating at a capacity factor of 35% in a region with average wind speeds sufficient to approach rated output regularly, a 3% production loss represents roughly 18,000 kilowatt-hours annually. Across a 100-turbine wind farm, that figure approaches 1.8 million kilowatt-hours per year—output that, at a power purchase agreement rate of $25 per megawatt-hour, translates to approximately $45,000 in annual lost revenue from erosion alone. Larger facilities with higher-capacity turbines and more aggressive erosion environments face proportionally larger financial exposure.
Regional Variation in Erosion Severity
Not all US wind regions experience leading-edge erosion at the same rate. The severity of surface degradation is a function of tip speed, precipitation intensity, particle density in the local atmosphere, and the frequency of high-impact weather events. These variables differ substantially across the geographic spread of American wind development.
Offshore projects along the Atlantic seaboard and in the Great Lakes represent some of the highest-erosion environments in the country. Salt spray, persistent precipitation, and the high tip speeds associated with larger offshore turbine designs combine to accelerate surface breakdown. Operators in these environments have reported visible leading-edge damage on blades within 18 to 24 months of commissioning—a timeline that compresses the maintenance planning window significantly.
Onshore facilities in the central plains—Kansas, Oklahoma, the Texas Panhandle—contend with a different erosion profile. Precipitation events are less frequent but often more intense, and airborne particulate matter including dust and agricultural debris adds an abrasive dimension that compounds rain impact damage. In the Pacific Northwest, high-altitude sites face ice accretion events that, when shed at operating speeds, can strip protective coatings and expose the underlying laminate to accelerated erosion in subsequent seasons.
The wind corridor stretching through the upper Midwest presents yet another pattern: moderate but consistent precipitation across a long operating season, producing steady erosion accumulation that may not trigger immediate concern but compounds substantially over a 20-year project life.
Measuring the Gap: Power Curve Analysis as a Diagnostic Tool
Quantifying erosion-driven losses in the field requires moving beyond visual blade inspection toward systematic power performance analysis. A turbine's power curve—the relationship between wind speed and electrical output—is the most direct expression of its aerodynamic health. As erosion degrades blade surfaces, the power curve shifts: output at moderate wind speeds below rated capacity declines, the curve's slope flattens, and the gap between the manufacturer's reference curve and measured performance widens.
Operators with robust SCADA data archives can track this degradation longitudinally, comparing normalized power curves across successive years of operation while controlling for wind resource variability through methods such as the IEC 61400-12-1 standard's binning approach. Facilities that have conducted this analysis systematically report that power curve degradation attributable to blade condition is often detectable within three to five years of commissioning and accelerates meaningfully after year seven or eight as erosion progresses from surface roughness into structural pitting.
Some operators have begun deploying drone-based inspection programs on annual or biennial cycles, using high-resolution imaging and increasingly AI-assisted defect classification to quantify erosion severity across the blade span. These inspection datasets, correlated with power performance records, are building a clearer picture of the relationship between measurable surface condition and generation losses—data that is strengthening the business case for proactive maintenance intervention.
Repair Economics and the Intervention Threshold
The repair landscape for leading-edge erosion has matured considerably over the past decade. At the less invasive end of the spectrum, leading-edge protection tape—applied either at the factory or retrofitted in the field—offers a relatively low-cost barrier against further damage on blades that have not yet progressed beyond surface roughness. For blades with more advanced erosion, erosion-shield systems using polyurethane or fiberglass overlays can restore the original profile geometry and recover a substantial portion of lost aerodynamic performance.
Full leading-edge restoration, involving grinding back damaged material and applying new coatings or structural reinforcement, represents the most comprehensive intervention but carries higher cost and requires either rope-access technicians working at height or temporary crane mobilization. For offshore facilities, logistics and weather windows add further cost complexity.
The economic calculus depends on the severity of existing damage, the remaining project life, and local energy prices. Industry analyses generally indicate that proactive erosion protection applied before significant damage occurs—either at manufacturing or within the first two years of operation—delivers a stronger return on investment than reactive repair programs that address damage only after measurable power losses are established. A 2021 analysis published in the journal Wind Energy estimated that leading-edge protection applied at installation could prevent cumulative losses equivalent to 1% to 2% of lifetime energy production, a figure that represents millions of dollars at utility-scale project sizes.
A Performance Metric That Demands Attention
For US wind operators focused on maximizing the financial yield of their assets across a 20- to 25-year project life, leading-edge erosion deserves treatment as a first-order performance variable rather than a secondary maintenance consideration. The losses it imposes are real, cumulative, and—critically—largely preventable with well-timed intervention.
As the American wind fleet ages and a growing proportion of installed capacity moves past the ten-year mark, the aggregate performance drag from erosion across the national portfolio will only grow. Operators who build erosion monitoring and mitigation into their asset management frameworks now will be better positioned to defend the power output their projects were designed to deliver—and to close the gap between nameplate potential and measured reality that erosion, year by year, quietly widens.